



Business intelligence helps an organisation turn operational data into information people can examine and use. A useful dashboard begins with a business question, a consistent definition and an accountable decision-maker. This article explains the basic workflow, a practical delivery example, and the controls that prevent attractive reports from hiding unreliable data or unsupported conclusions.
What business intelligence actually means
Business intelligence, or BI, combines processes and technology for collecting, preparing, analysing and presenting business data. IBM describes it as a way of turning organisational data into insights that inform strategy and operations. It is not another name for corporate vision, and buying a dashboard application does not create a data-driven organisation.
A report presents information. A key performance indicator, or KPI, measures progress towards an objective and is assessed against an agreed target. A target states the desired level. A decision is the action an authorised person chooses after considering the evidence. Keeping these concepts separate prevents a page of colourful numbers from being mistaken for a management system.
Begin with the decision the report must support
Choose a recurring question with a clear owner. For example: “Which causes of late delivery should the operations team address first?” Define when the decision is made, which information is needed and how quickly it must be available. A weekly staffing decision rarely requires a continuously updating screen.
Write the question before evaluating tools. A small organisation may begin with a controlled spreadsheet and a documented review meeting. More complex environments may require integrated data platforms. The appropriate choice depends on data volume, access controls, refresh requirements and the skills available to maintain the solution.
Build a dependable information flow
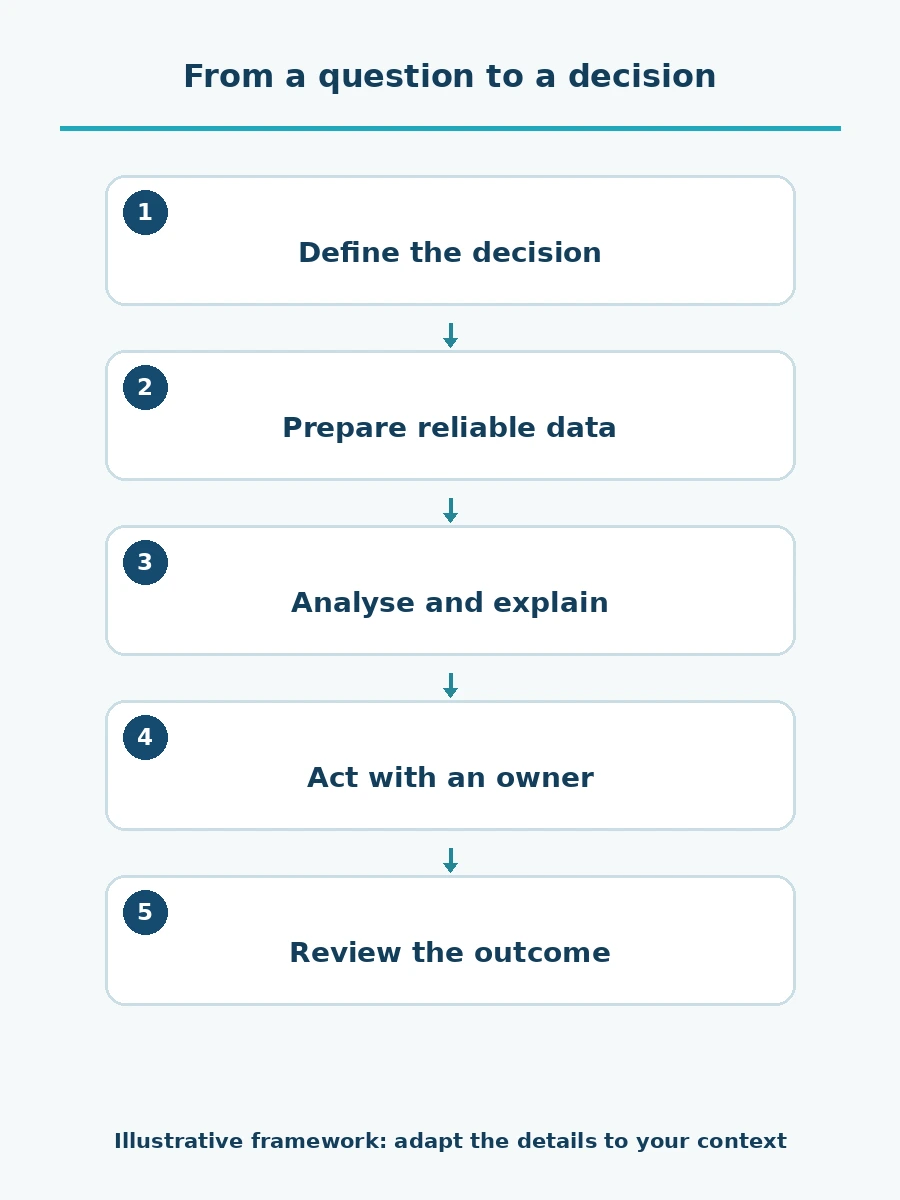
Start with identified source records, then check and transform them into agreed definitions. Present the results in a form that allows investigation. The process ends with a recorded decision and follow-up, not the publication of a dashboard.
For every important field, identify who owns the source and who can correct an error. Keep original records available for authorised investigation. A transformation that silently removes unusual records may make the report look cleaner while concealing a real service problem.
Worked example: understanding late deliveries
Consider a fictional distributor investigating missed delivery promises. This example is illustrative, not a reported ATMACSS engagement. Its orders system records the promised date, while the delivery system records completion. The team first agrees which promise counts: the original commitment or a later agreed revision. It also defines the treatment of partial deliveries and cancelled orders.
Suppose 200 eligible orders were due during the reporting period and complete records confirm that 170 were delivered in full by the agreed deadline. The remaining 30 were delivered late or were still undelivered after their deadline. On-time delivery is 170 divided by 200, or 85%. Keep overdue undelivered orders in the denominator; counting only completed deliveries would hide part of the problem. Document cancellation and partial-delivery rules and the reporting cut-off. Preserve the original promise and the history of approved changes so that revising a date cannot silently erase a missed commitment.
If the illustrative target is 95%, the result is 10 percentage points below target. The target is a management choice for this example, not an industry benchmark. Where delivery status is unknown because records are missing, show the unresolved count and qualify the result rather than treating missing data as confirmed success or silently excluding it.
Next, compare late orders by route, product and reason. A concentration on one route is a signal to investigate, not proof that the driver caused the delay. Stock shortages, scheduling constraints and incorrect customer details may explain the pattern. The team checks the underlying records before assigning corrective action. Record an action owner, due date and follow-up measure. At the next review, use the same definitions to check whether the action was completed and whether delivery performance improved.
A small data dictionary makes reports comparable
| Item | Definition to document | Why it matters |
|---|---|---|
| Order | The unique transaction included in the report | Prevents duplicate counting |
| Delivery promise | The date used to judge timeliness | Prevents moving the goalposts |
| Eligible population | Orders included and excluded | Makes the denominator visible |
| Refresh time | When source data was last updated | Shows how current the result is |
| Owner | Person responsible for the definition | Gives users a route to resolve disputes |
The dictionary should be accessible to report users. Explain any break in comparability when a definition changes. Keeping the old and new calculations temporarily may help the team understand the effect before retiring the old measure.
Design the screen around investigation
Show the main question, reporting period, measure definition and comparison first. Use a chart only when it reveals a pattern more clearly than a table. Avoid decorative gauges, unexplained colour thresholds and truncated axes that exaggerate small differences.
Offer an appropriate level of detail for the audience. A manager may need a branch comparison; an authorised analyst may need transaction records. Restrict access according to responsibilities and minimise personal data. Decide how exports, shared links and access removal will be controlled before rolling out the report.
Separate description from prediction and causation
A historical trend describes what the data shows. A forecast estimates what may happen under assumptions. Neither establishes the cause of an outcome by itself. If a new process coincides with faster delivery, other changes may also have contributed.
Label estimates and data gaps clearly. Check missing values, duplicates, unexpected dates and reconciliation with source totals. Agree what happens if a refresh fails. Showing an old result without a visible timestamp can be more misleading than temporarily showing no result.
Make refresh failures visible to users
Agree how to flag a report whose refresh has not completed and who will investigate and notify affected users. Do not present the time a page was opened as the time its source data was updated. After restoring the refresh, reconcile the results and affected records before removing the warning. Retain the cause and remedial action so recurring failures can be reviewed. A dashboard that makes its data limitations clear supports decisions better than one that merely appears current.
Make adoption part of the implementation
Pilot the report with the people who will use it. Ask them to explain the main result and the decision it supports. Record misunderstandings, revise the display and provide short training using actual work questions. Assign an owner to maintain definitions and investigate failures after launch.
Evaluate usefulness through the decisions and actions supported, not just the number of dashboards produced. For help connecting measures to organisational priorities, discuss Strategic Planning & KPIs with ATMACSS. Our KPI design article explains the relationship between an objective, a measure and a target.