



Financial business analysis examines financial information to understand performance, financial position and cash generation. It connects the numbers with the activities that produced them. A useful review explains why a result changed, what remains uncertain and which decision needs attention. Management consultants can help investigate operating causes, working with finance professionals rather than replacing accounting, audit or specialist tax work.
Start with the decision and reconcile the records
Define the question: is pricing covering delivery costs, can the business meet near-term commitments, or is growth consuming cash? Then agree the period, business units and accounting basis. Obtain the income statement, balance sheet, cash-flow information and relevant supporting schedules. A dashboard summary alone may omit the evidence needed to explain a movement.
Reconcile management figures to the underlying records before calculating ratios. Identify missing invoices, unusual adjustments and changes in classification. Compare equivalent periods and separate recurring operations from exceptional transactions. Record uncertainty instead of making incomplete accounts look precise.
Read profit, financial position and cash together
The income statement reports revenue and expenses over a period. The balance sheet reports assets, liabilities and equity at a date. Cash-flow information explains cash movements. They answer different questions. A profitable sale made on credit may not yet have produced cash, while borrowing can increase cash without increasing operating profit.
Receivables are amounts customers still owe. An ageing schedule groups those balances by how long they have been outstanding or overdue. Inspect this schedule, inventory movement and payment commitments alongside headline balances. A large receivable is less useful for paying suppliers if it is disputed or overdue. Check whether a positive cash balance depends on delayed payments or new borrowing rather than sustainable operating receipts.
Use ratios as questions, not verdicts
Gross profit is revenue less cost of sales. In this example, deducting operating expenses then gives operating profit. Each margin expresses the relevant profit as a percentage of revenue. The current ratio divides current assets by current liabilities; it is a multiple, not a percentage.
Hypothetical example for illustration: the table uses one business and amounts in AED.
| Illustrative measure | Calculation | Result |
|---|---|---|
| Gross profit margin | (1,000,000 − 650,000) ÷ 1,000,000 × 100 | 35% |
| Operating profit margin | (350,000 − 250,000) ÷ 1,000,000 × 100 | 10% |
| Current ratio | 300,000 current assets ÷ 200,000 current liabilities | 1.5 |
All amounts are fictional AED figures for one business. Revenue is 1,000,000 and cost of sales is 650,000, leaving gross profit of 350,000. Operating expenses are 250,000. Current assets are 300,000 and current liabilities are 200,000. Income measures cover one year; balance-sheet measures are at year-end. No tax or financing calculation is implied. These ratios are neither targets nor evidence of good performance on their own. Compare consistent definitions, prior periods and a genuinely comparable business model.
A current ratio of 1.5 does not reveal whether the assets can become cash before liabilities fall due. The table also cannot explain the operating margin without details of price, sales mix, direct costs and overheads.
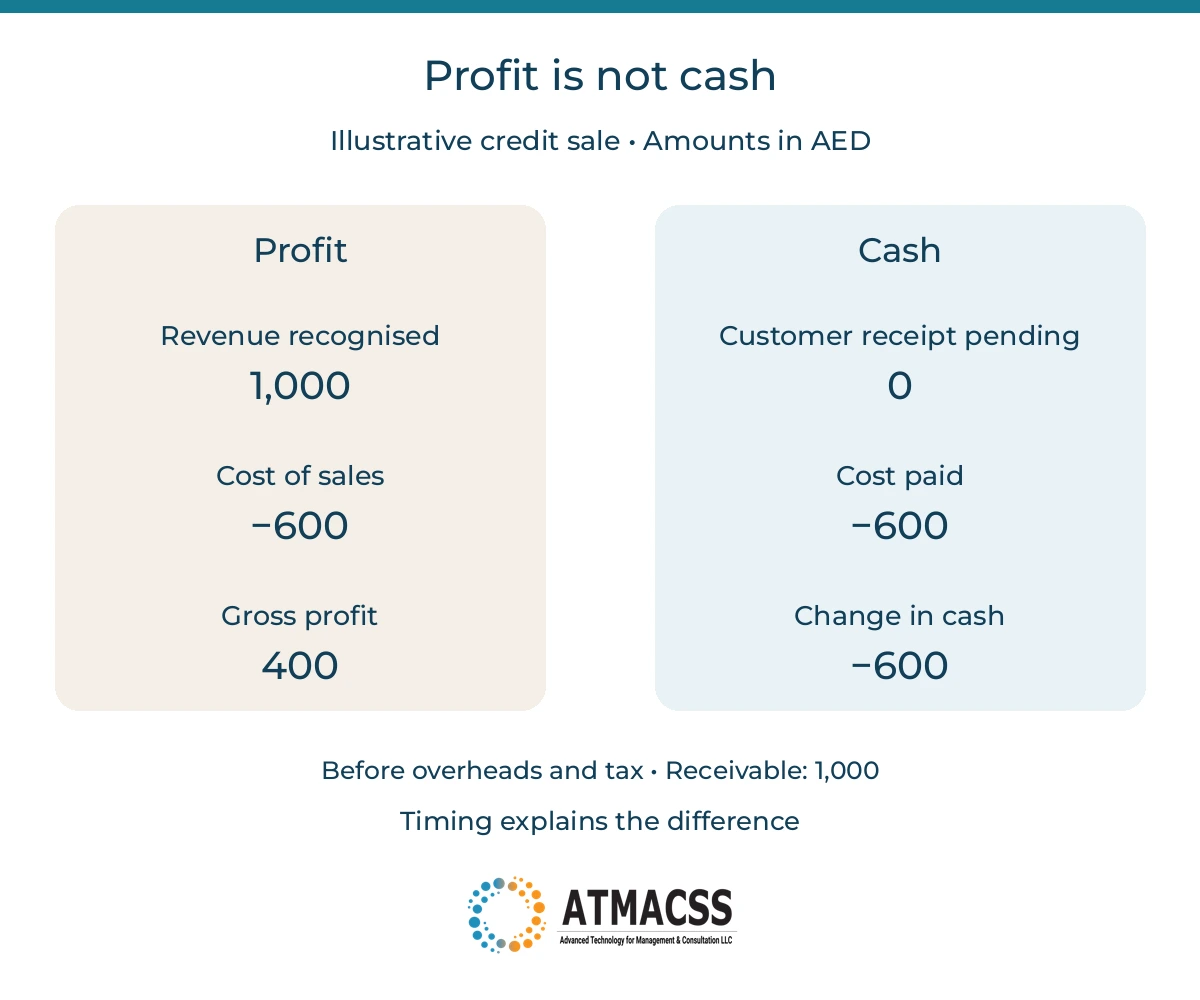
In this separate fictional transaction, revenue of AED 1,000 is recognised and the related cost of AED 600 is paid. Gross profit is AED 400, but the customer has not paid yet. Cash has fallen by AED 600 and the receivable is AED 1,000. The example excludes overheads and tax.
Trace the change to an operating cause
Break a margin movement into questions about prices, discounts, product mix, purchase costs and delivery effort. If revenue rose while profit fell, investigate whether lower-margin work grew faster or rework increased. Do not conclude that staff productivity declined merely because total payroll increased.
Use operational evidence: order records, approved price changes, supplier invoices, time records and rework logs. A consultant can map the process and interview responsible teams, while finance checks the accounting treatment. The output should distinguish a confirmed cause, a plausible explanation and a gap needing evidence.
Explain the change in gross profit step by step
Hypothetical example for illustration: in a separate case, a business sells 100 identical units at AED 100 each, with a direct cost of AED 60 per unit. Revenue is 10,000 and gross profit is 4,000. In the next comparable period, it sells 120 units at AED 95, while unit cost remains 60. Revenue rises to 11,400, but gross profit is 4,200 and the margin falls from 40% to approximately 36.8%. More revenue has produced only 200 of additional gross profit.
Explain the change in two steps. The extra 20 units contribute 800 at the original unit margin of 40. The price reduction of 5 applies to all 120 units and reduces gross profit by 600. Together, these effects explain the 200 increase. This simplified bridge assumes one product, unchanged unit cost and comparable accounting. With several products, separate mix changes and avoid counting the same effect twice.
Before recommending a price increase, check the approved discount, customer commitments, returns and the cost of serving the additional orders. An extra delivery shift could consume the small gain. Finance verifies the figures; the commercial and operations owners explain the activity and assess alternatives. Record the chosen action and revisit both profit and customer response. These figures are a teaching example, not company results or a pricing recommendation.
Test cash timing and alternatives
Build a cash forecast with expected receipt and payment dates. Test a delayed customer payment, slower stock sales or a supplier requiring a deposit. Show which assumption changes, its source and the resulting funding gap. Scenarios describe possible outcomes; they are not guaranteed forecasts.
Compare corrective actions and their consequences. Faster collection may require resolving disputed invoices rather than sending more reminders. Cutting stock can release cash but also affect delivery. Review customer and operational impacts before treating every expense reduction as an improvement.
Assign an action and preserve professional boundaries
Summarise the issue, supporting evidence, proposed action, owner and review date. Choose a measure that can show whether the intervention worked, such as overdue invoices resolved or avoidable rework reduced. Retain the starting position and explain changes in definitions.
Financial analysis does not provide an audit opinion or guarantee the accuracy of the accounts. Funding, tax and investment decisions may require specialist advice. ATMACSS business and operations modelling can connect financial questions with process design and responsibilities. Begin with one material question and a reconciled set of records.